Learn to Read a Stock Chart Like a Pro
Investing in the stock market can be an exciting venture. Whether you’re a newcomer or a familiar face on Wall Street, understanding how to navigate the sea of numbers, lines, and graphs is fundamental. A stock chart is the map that guides you through the tides of the market, showing the ebb and flow of stock prices over time. Let’s set you on the course to reading a stock chart like a seasoned pro!
Step into the World of Stock Charts
The first thing to know is that stock charts present a wealth of information. They can look daunting at first; however, with a bit of guidance, you’ll decode them in no time. Imagine you’ve just unearthed a treasure map; the steps to the bounty are there, you just need to know how to follow them.
Types of Charts
Before we delve into the details, it is important to recognize the common types of charts used by investors:
- Line Chart: This is the most basic form, representing only the closing prices over a set period. It’s a good starting point for beginners.
- Bar Chart: Also known as the OHLC chart, it shows the Open, High, Low, and Close prices for each day. The vertical bar represents the high and low, while a small horizontal line on the left reflects the open price and on the right, the close.
- Candlestick Chart: Similar to the bar chart, but more visual. It uses “candles” to show the same data, where the body of the candle is the range between open and close, and the wicks represent high and low. A green or clear candle means the close was above the open, and a red or filled candle indicates the close was below the open.
Read the Xs and Os: Understanding Price and Time
Every stock chart has at least two axes: the x-axis (horizontal) and the y-axis (vertical). Simply put, the x-axis shows the time frame you are looking at, which could range from a single day to several years. Meanwhile, the y-axis shows the price of the stock. Together, they paint a picture of the stock’s performance.
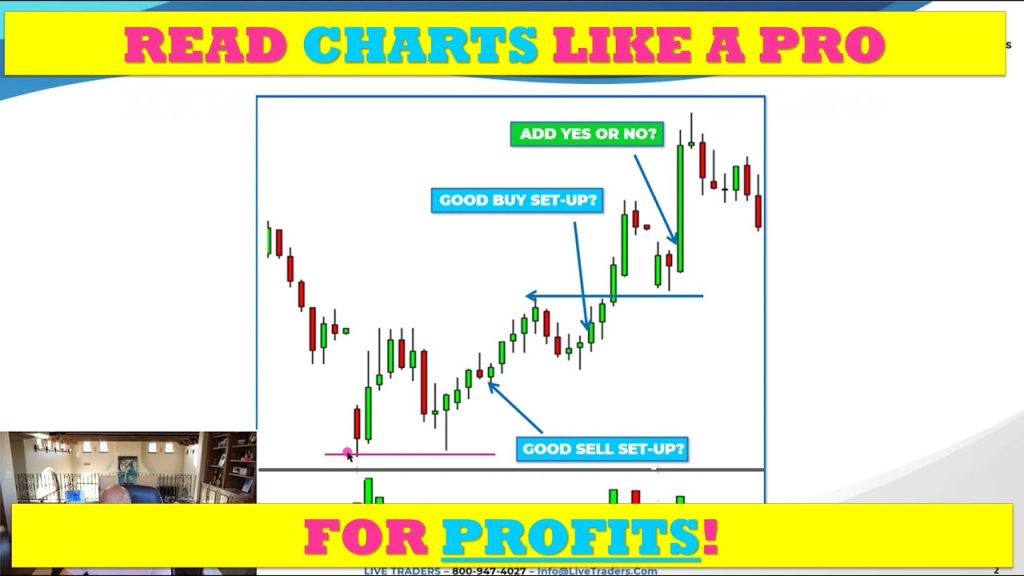
Decoding the Candlestick
Let’s zoom in on the candlestick chart, as it is one of the most information-rich and widely used by professionals in the industry.
- The Candle Body: The wide part of the candlestick, called the “real body,” represents the range between the opening and closing prices. If the body is filled or colored, usually in red or black, the stock closed lower than it opened. If it is clear or green, it closed higher.
- The Wicks: These are the thin lines above and below the body, also called “shadows” or “tails.” They show the highest and lowest traded prices of the stock for that time frame.
Patterns within the candles and their sequence can indicate future price movements. For example, a series of candles with little to no wicks may indicate a trend with strong momentum.
Understanding Trends and Patterns
Just identifying the parts of a chart won’t make you a pro, understanding the story they tell is crucial. Stock charts are all about identifying trends and patterns that indicate where a stock may be headed next.
Bulls, Bears, and Sideways Markets
When you hear someone talking about a bull market, they’re referring to a market that’s on the rise, while a bear market is declining. A “sideways market” or “range-bound market” is when stock prices move within a horizontal range.
Spot the Trend
To identify a trend:
- Uptrend: Look for a series of higher highs and higher lows.
- Downtrend: Look for lower highs and lower lows.
- Horizontal: When the highs and lows are roughly at the same levels.
Simple, right? Spotting these patterns is like identifying footprints in the sand; they show you the path the stock has followed.
Key Patterns to Know
Some common patterns include:
- Head and Shoulders: Suggests a reversal in trend.
- Double Top and Double Bottom: Indicate the potential end of a bullish or bearish trend.
- Triangles: Depending on the orientation, can signal continuation or reversal.
Memorizing patterns is good, but understanding what they mean is better. It’s like the difference between knowing the words to a song and actually feeling the music.
Volume: The Wind Behind the Sails
In the context of a stock chart, volume is represented by bars along the bottom. Think of volume as the wind for a sailboat—it provides the momentum that can either push a trend forward or cause it to stall.
- A surge in volume on a day when a stock price increases could indicate strong buyer interest.
- On the flip side, an uptick in volume on a down day could suggest that sellers are in control.
Low volume, much like calm winds, suggests that there might not be much commitment behind price movements, while high volume indicates strong conviction.
Indicators and Oscillators
As you become more comfortable reading stock charts, you’ll encounter a variety of indicators and oscillators—these are the tools that can fine-tune your analysis.
- Moving Averages: These help smooth out price action to identify the trend. The most common are the 50-day and 200-day moving averages.
- MACD (Moving Average Convergence Divergence): This momentum indicator shows the relationship between two moving averages of a stock’s price.
- RSI (Relative Strength Index): An oscillator that measures the speed and change of price movements, often used to identify overbought or oversold conditions.
Indicators can be adjusted to meet your specific strategy or the unique characteristics of the stock you’re analyzing. They’re like customizable parts of your toolkit, with each tool having a specific purpose.
Practice Makes Perfect
Mastering the art of reading stock charts doesn’t happen overnight. It takes practice, patience, and a bit of trial and error. Start with historical charts to see how certain patterns played out over time before trying to predict future movements.
Remember, no tool or pattern can predict stock prices with 100% accuracy. Always do your due diligence and consider the broader context of the market. Think of chart analysis as part of your decision-making process, not the whole process.
Tying It All Together
Reading stock charts is akin to mastering a new language—the language of the markets. Just as you wouldn’t expect to converse fluently in a new language overnight, anticipate a learning curve as you familiarize yourself with this valuable skill.
The key takeaway is to start with the basics: identify the types of stock charts, understand the significance of price and time on the axes, and learn to spot trends and interpret significant chart patterns. Gradually incorporate volume and technical indicators into your analysis for a more nuanced understanding of stock movements.
With time and experience, the once intimidating charts become windows into the market’s collective mind, helping you make informed decisions. By developing this expertise, the prospect of joining the ranks of professional traders and investors becomes a reality.
Keep an open mind, continue to learn, and practice regularly—and you’ll read those charts like a seasoned pro in no time!