Screen for Value With the P/E Ratio and More
Investing in the stock market can feel like navigating an endless sea of companies and fluctuating prices. For those looking to find a financial foothold, searching for value in the stock market is akin to searching for treasure on an expansive beach. You need the right tools. Enter the price-to-earnings ratio, commonly known as the P/E ratio, a tool renowned for its usefulness in boiling down seemingly complex financial data into more digestible indicators of a stock’s value.
But the P/E ratio is far from the only instrument in an investor’s toolkit. Understanding additional measures can further empower investors to make smart, informed decisions. Let’s explore how to screen for value in stocks by using the P/E ratio and other valuable metrics.
Understanding the P/E Ratio
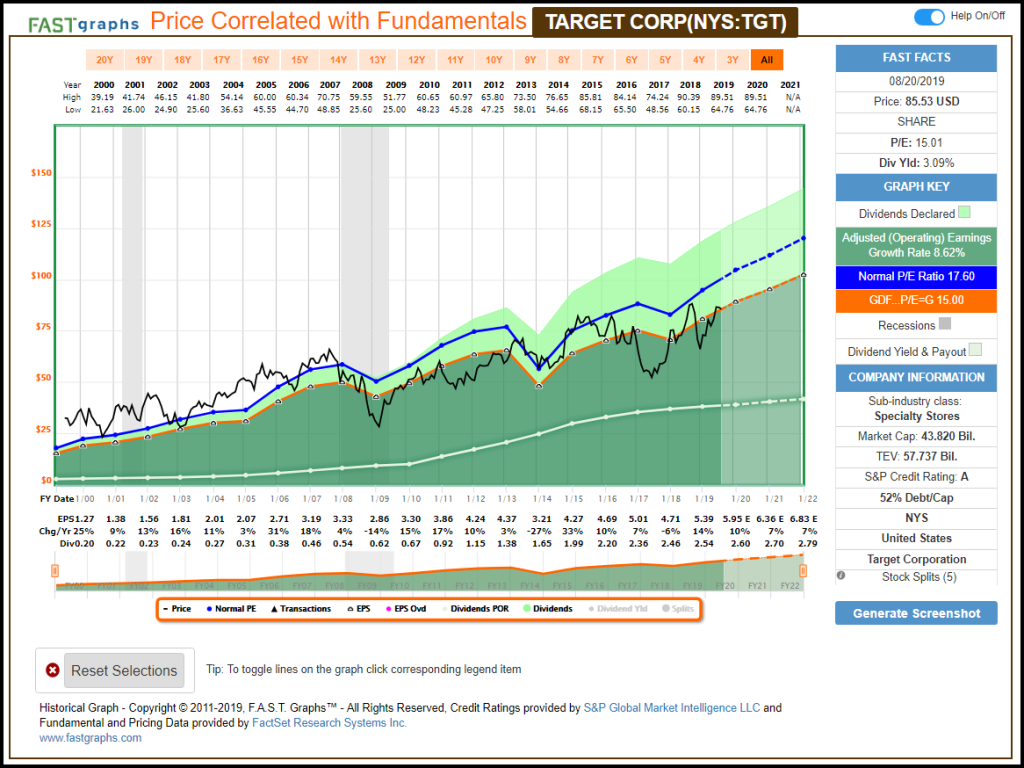
Picture yourself in a market. You see stalls with various goods – some look overpriced, while others seem like great deals. How do you decide what’s worth your money? In stock market terms, the P/E ratio helps you to make that very decision. It compares a company’s share price to its earnings per share (EPS).
A lower P/E ratio might suggest that the stock is undervalued – a deal in investor’s terms – yielding more earnings for each dollar you pay. Conversely, a higher P/E can indicate overvaluation, suggesting you’re paying a lot for less. It’s the classic deal-or-no-deal scenario.
How to Calculate P/E Ratio
Calculating the P/E ratio is straightforward:
\[ \frac{\text{Current Market Price}}{\text{Earnings Per Share (EPS)}} = \text{P/E Ratio} \]
EPS can be derived from the last 12 months (trailing P/E) or from projections for the next 12 months (forward P/E). Each tells a different story: trailing P/E looks at the concrete past while forward P/E speculates on the potential future.
Limitations of P/E Ratio
Now, the P/E ratio is indeed handy, but it’s not a silver bullet. Some of its limitations include not accounting for future growth potential (far-out earnings prospects might justify a higher P/E) and not considering debt (a company with less debt might deserve a higher valuation). It’s also less useful for comparing companies across different industries where average P/Es can vary widely.
Combining P/E With Other Metrics
Relying solely on the P/E ratio would be like trying to paint a masterpiece with only one color. Investors can benefit from bringing other financial metrics into the mix.
Price-to-Book (P/B) Ratio
The P/B ratio helps in assessing whether a stock is undervalued or overvalued by comparing the stock’s market value to its book value:
\[ \frac{\text{Current Market Price Per Share}}{\text{Book Value Per Share}} = \text{P/B Ratio} \]
This measure is particularly informative for companies with significant physical assets. A lower P/B can indicate that a company’s market value is less than its stated net asset value, again hinting at potential undervaluation.
Debt-to-Equity Ratio
The Debt-to-Equity Ratio gives insight into a company’s leverage by showing the extent to which its operations are financed by debt versus its own funds:
\[ \frac{\text{Total Liabilities}}{\text{Shareholders’ Equity}} = \text{Debt-to-Equity Ratio} \]
A high ratio suggests a company might be aggressively financing growth with debt, potentially amplifying both profit and loss. A lower ratio can mean the company is funding itself more responsibly – but also that it might be missing out on growth opportunities.
PEG Ratio (Price/Earnings to Growth)
The PEG ratio builds upon the P/E by considering the expected earnings growth rate:
\[ \frac{\text{P/E Ratio}}{\text{Annual EPS Growth}} = \text{PEG Ratio} \]
For instance, a lower PEG ratio could be a signal of an undervalued stock given its growth prospects. When a stock’s PEG is less than 1, it might be more attractive, as it suggests the market may be undervaluing the earnings growth potential.
Dividend Yield
For income investors, the dividend yield is particularly important, as it indicates how much cash flow you’re getting for your investment:
\[ \frac{\text{Dividend Per Share}}{\text{Stock Price Per Share}} = \text{Dividend Yield} \]
A higher yield potentially means more income, but beware – it can also be a signal of trouble if the company’s share price is falling due to operational issues.
Using These Metrics Wisely
Now, having these tools at your disposal is one thing, but using them effectively is another. Let’s dive into a few guiding principles to help you apply these metrics prudently in your investing journey.
Industry Context
Align your expectations with industry norms. High P/E ratios are more common in fast-growing industries like technology. Meanwhile, mature industries often have lower benchmarks. Understanding the context can save you from misidentifying stocks as under or overvalued.
Company Lifecycle
Where a company stands in its lifecycle is vital; newer companies often reinvest earnings into growth, which could suppress their present earnings and inflate their P/E ratios. Conversely, established companies might have more predictable earnings and thus more stable P/E ratios.
Investment Goals
Your investment strategy should dictate which metrics matter to you. Looking for steady returns? Dividend yield might be your go-to. Eyeing growth? PEG ratio and forward P/E could better serve your needs. Always tailor your metrics to your specific investing goals.
Economic Climate
Economic trends can massively influence these metrics. Low interest rates have led to higher acceptable P/Es in recent times because as borrowing is cheaper, growth is typically more robust, and investors are willing to pay more for earnings.
Putting It All Together – A Practical Approach
The trick lies not in mastering each individual metric but in learning how to weave them into a coherent narrative.
Imagine you’re considering a stock in a growing tech firm. It has a high P/E ratio, suggesting overvaluation. But then, you look at the PEG ratio and find it’s below 1, indicating solid growth prospects that might justify the high P/E. The debt-to-equity ratio is within a reasonable range, and the P/B is relatively low.
Contextualizing all these metrics, you see a growing company, financed responsibly, with ample room for growth, and a stock that’s potentially undervalued by the market. Suddenly, that high P/E doesn’t look so scary.
Remember, these metrics are guides, not gospel. They are best used in conjunction with thorough research, including understanding the company’s business model, competitive advantages, management quality, and market potential. Financial metrics illuminate aspects of a stock’s value, but much like a good story, it’s the fuller picture that gives meaning to the individual words.
Conclusion
The world of investing is multifaceted and ever-changing. Tools like the P/E ratio, P/B ratio, debt-to-equity ratio, PEG ratio, and dividend yield are invaluable for investors looking to find value in a crowded market. However, they should not be used in isolation.
Instead, employ these tools as part of a broader strategy that encompasses industry knowledge, company research, and an understanding of your personal investment goals and the economic landscape. Such a holistic approach to stock evaluation will position you to make well-informed investment decisions, helping you navigate the stock market with confidence and, hopefully, considerable success.
Remember, even the most promising metrics do not guarantee success; they merely improve the odds. Keep learning, stay disciplined in your strategy, and adapt as you gain experience. With these principles and tools in hand, you are well on your way to becoming a savvy investor.

